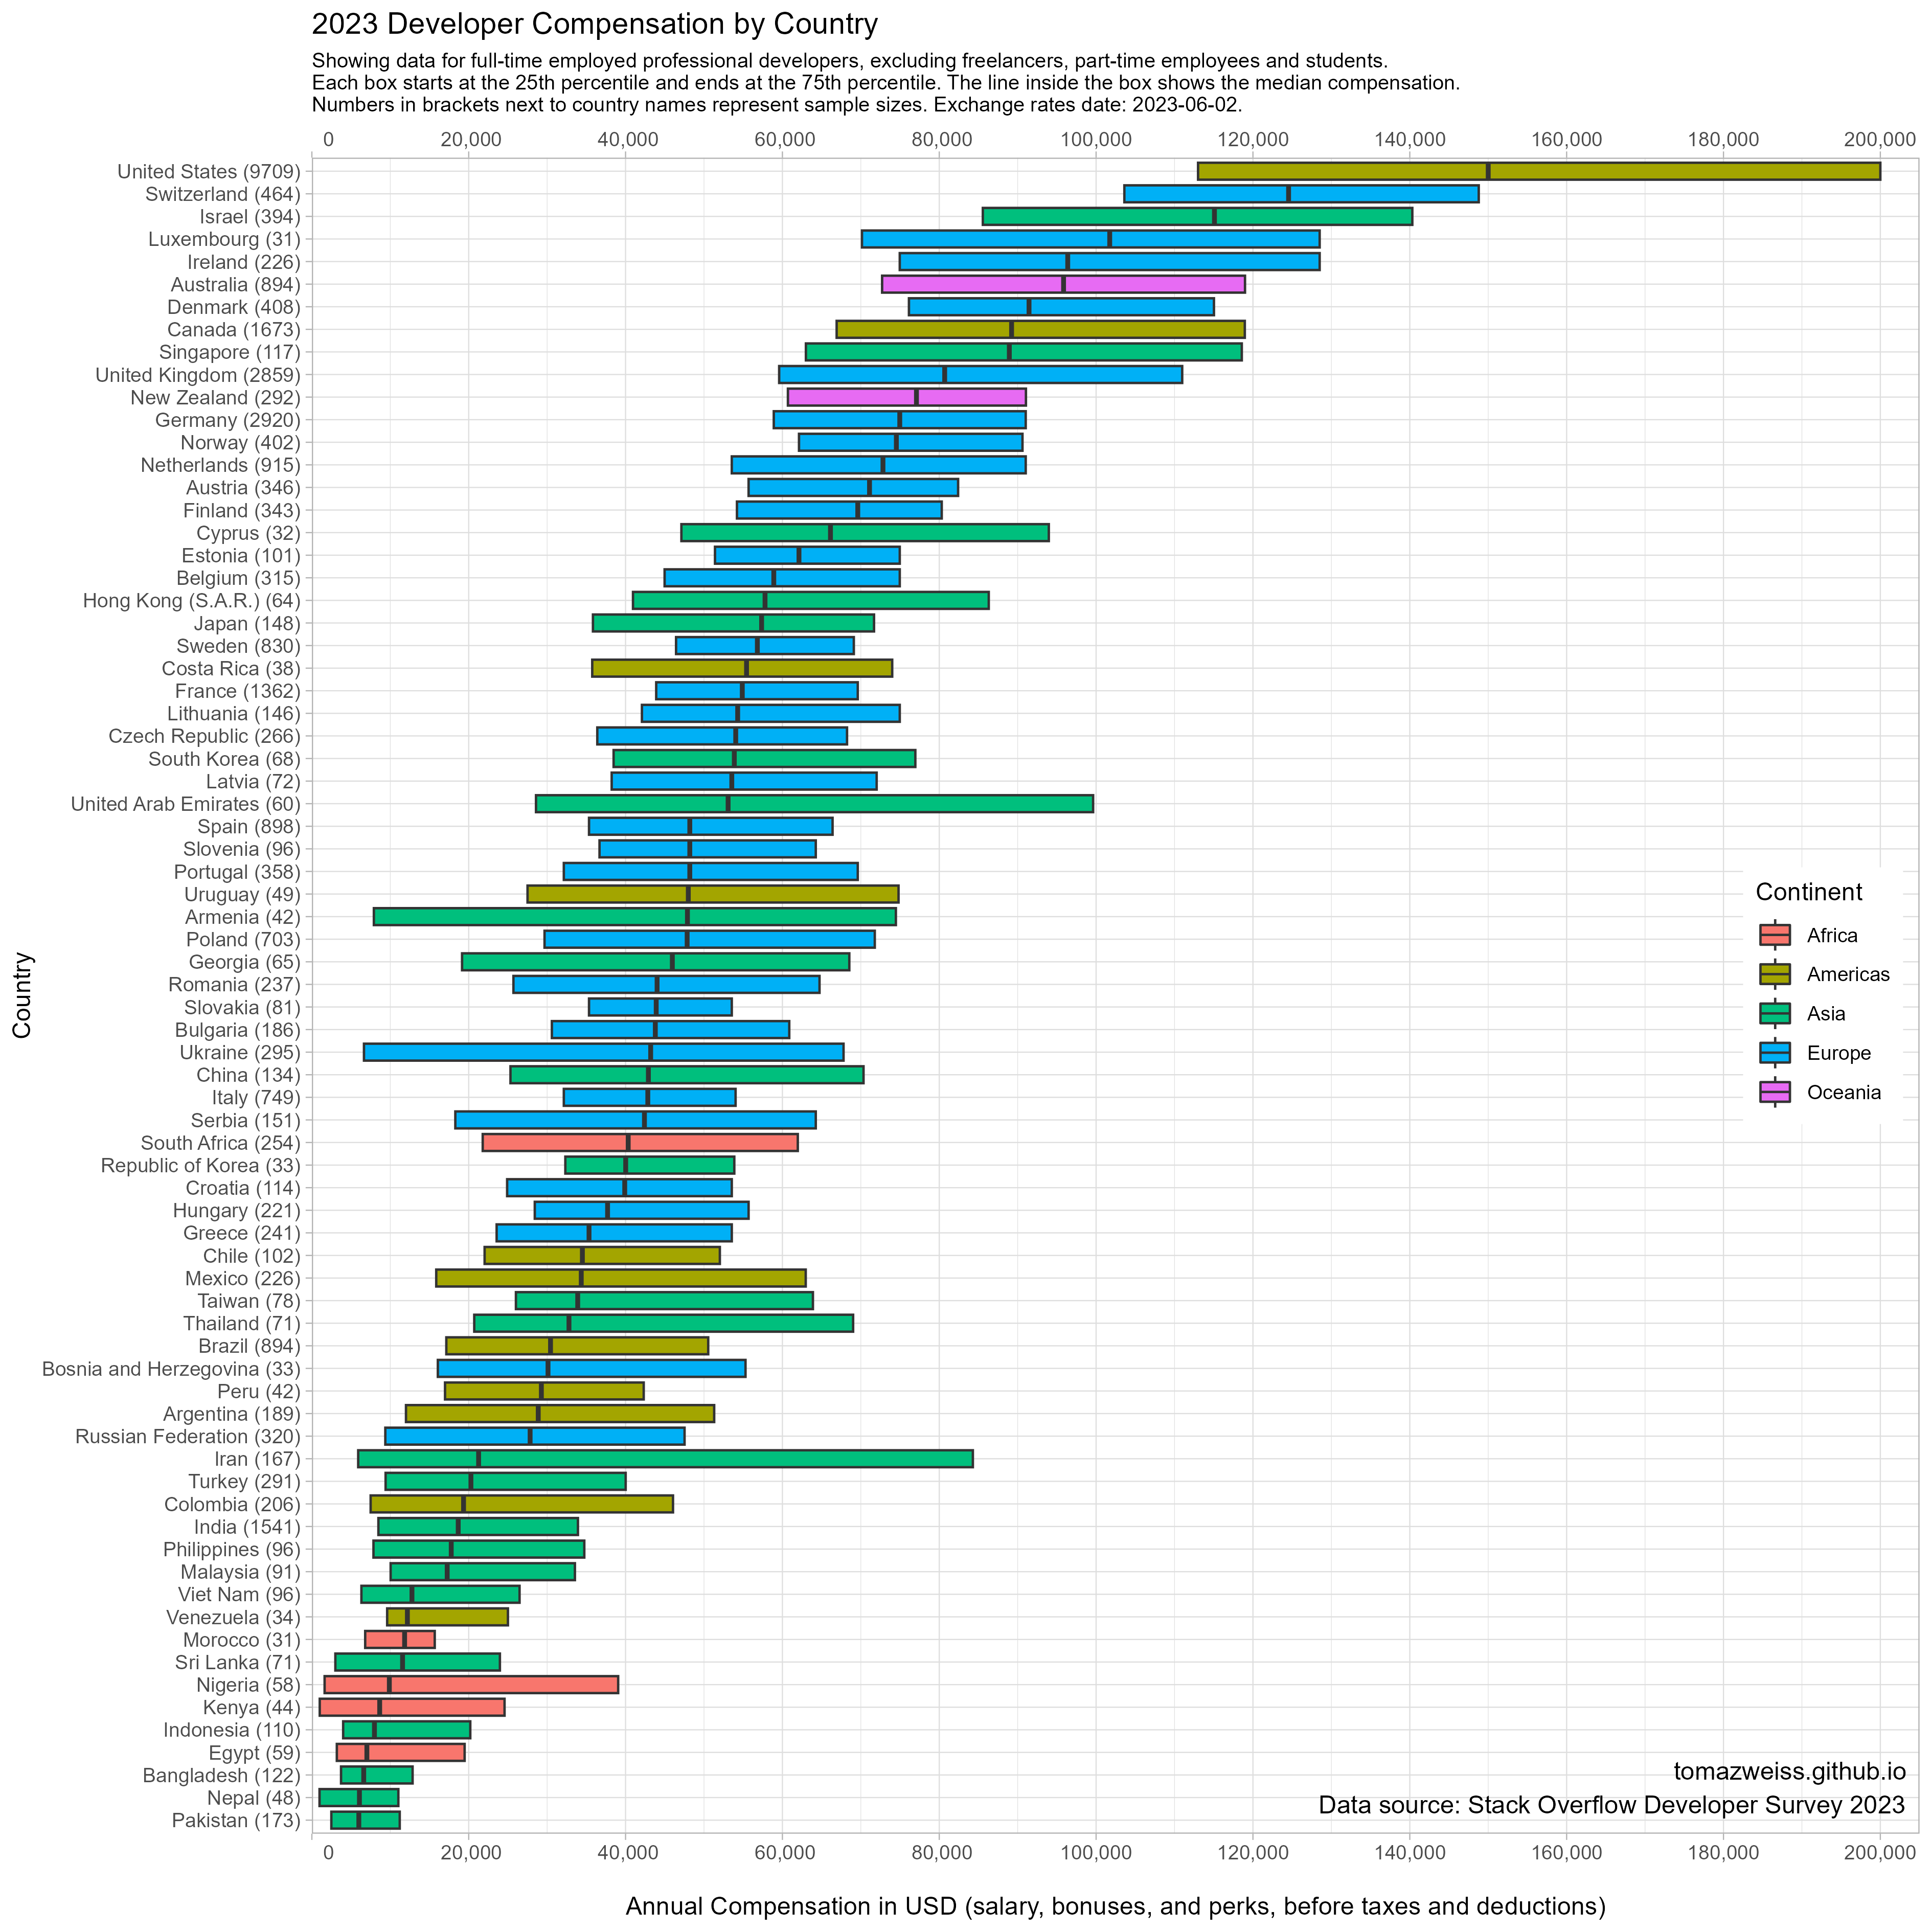
2023 Developer Compensation by Country
Exploring data from the Stack Overflow Developer Survey 2023 with simplified boxplots.
We should be aware that this survey data is biased. Countries with less than 30 responses after applying all filters have been removed from the image.
Found this content interesting or useful? Fuel future articles with a coffee!

The Code
# renv::init()

library(tidyverse)
library(janitor)
library(countrycode)


# data download -----------------------------------------------------------
# https://insights.stackoverflow.com/survey

# url <- 'https://cdn.stackoverflow.co/files/jo7n4k8s/production/49915bfd46d0902c3564fd9a06b509d08a20488c.zip/stack-overflow-developer-survey-2023.zip'
# destfile <- 'data/stack-overflow-developer-survey-2023.zip'
# download.file(url, destfile, method = "curl")


# data import -------------------------------------------------------------

data <- read_csv(unz('data/stack-overflow-developer-survey-2023.zip', 'survey_results_public.csv')) |>
  clean_names()


# data preparation -----------------------------------------------------------

data <-
  data |>
  filter(main_branch == 'I am a developer by profession') |>
  filter(employment == 'Employed, full-time') |>
  filter(!is.na(converted_comp_yearly), !is.na(country), converted_comp_yearly > 0) |>
  # make long country names shorter to save space on image
  mutate(country = case_when(country == 'United Kingdom of Great Britain and Northern Ireland' ~ 'United Kingdom',
                             country == 'Venezuela, Bolivarian Republic of...' ~ 'Venezuela',
                             country == 'The former Yugoslav Republic of Macedonia' ~ 'North Macedonia',
                             country == 'Iran, Islamic Republic of...' ~ 'Iran',
                             country == 'United States of America' ~ 'United States',
                             .default = country
                             ))


# number of respodents by country
country_n_resp <-
  data |>
  group_by(country) |>
  summarise(median_convertedcomp = round(median(converted_comp_yearly)), n_resp = n()) |>
  arrange(desc(n_resp))


# country - continent table
countries <-
  data |>
  distinct(country) |>
  mutate(continent = countrycode(sourcevar = country, origin = "country.name", destination = "continent"))


# boxplot visualization ---------------------------------------------------

fig <-
  data |>
  left_join(countries, by = "country") |>
  inner_join(country_n_resp |> filter(n_resp >= 30), by = "country") |>
  mutate(country = paste0(country, ' (', n_resp, ')')) |>
  mutate(country = reorder(country, converted_comp_yearly, median)) |>
  ggplot(aes(x = country, y = converted_comp_yearly, fill = continent)) +
  geom_boxplot(outlier.size = -1, coef = 0) +
  xlab('Country') +
  ylab('\nAnnual Compensation in USD (salary, bonuses, and perks, before taxes and deductions)') +
  coord_flip(ylim = c(0, 200000)) +
  scale_y_continuous(breaks = seq(0, 200000, by = 20000),
                     labels = function(x) format(x, big.mark = ",", decimal.mark = '.', scientific = FALSE),
                     expand = expansion(add = c(0, 5000)),
                     sec.axis = sec_axis(~ .,
                                         breaks = seq(0, 200000, by = 20000),
                                         labels = function(x) format(x, big.mark = ",", decimal.mark = '.', scientific = FALSE)
                                         )
                     ) +
  labs(title = '2023 Developer Compensation by Country',
       subtitle = paste0('Showing data for full-time employed professional developers, excluding freelancers, part-time employees and students.\n',
                         'Each box starts at the 25th percentile and ends at the 75th percentile. The line inside the box shows the median compensation.\n',
                        'Numbers in brackets next to country names represent sample sizes. Exchange rates date: 2023-06-02.')
       ) +
  # theme(plot.title.position = "plot") +
  scale_fill_discrete(name = "Continent") +
  annotate("text", x = 3.2, y = 188500, label = "tomazweiss.github.io") +
  annotate("text", x = 1.7, y = 165800, label = "Data source: Stack Overflow Developer Survey 2023") +
  theme_light() +
  theme(legend.position = c(0.94, 0.5)) +
  theme(plot.subtitle = element_text(size = 9))

fig

ggsave('so_2023_compensation.png', plot = fig, width = 300, height = 300, units = 'mm', dpi = 'retina')
GitHub
https://github.com/tomazweiss/stackoverflow_compensation_2023